Spitzer Lightcurves Subset

Credit: J. Voss (AMNH)
Chart • January 13th, 2022 • ssc2022-01a
ssc2022-01a
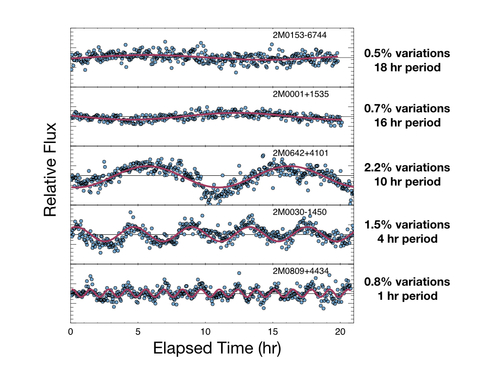
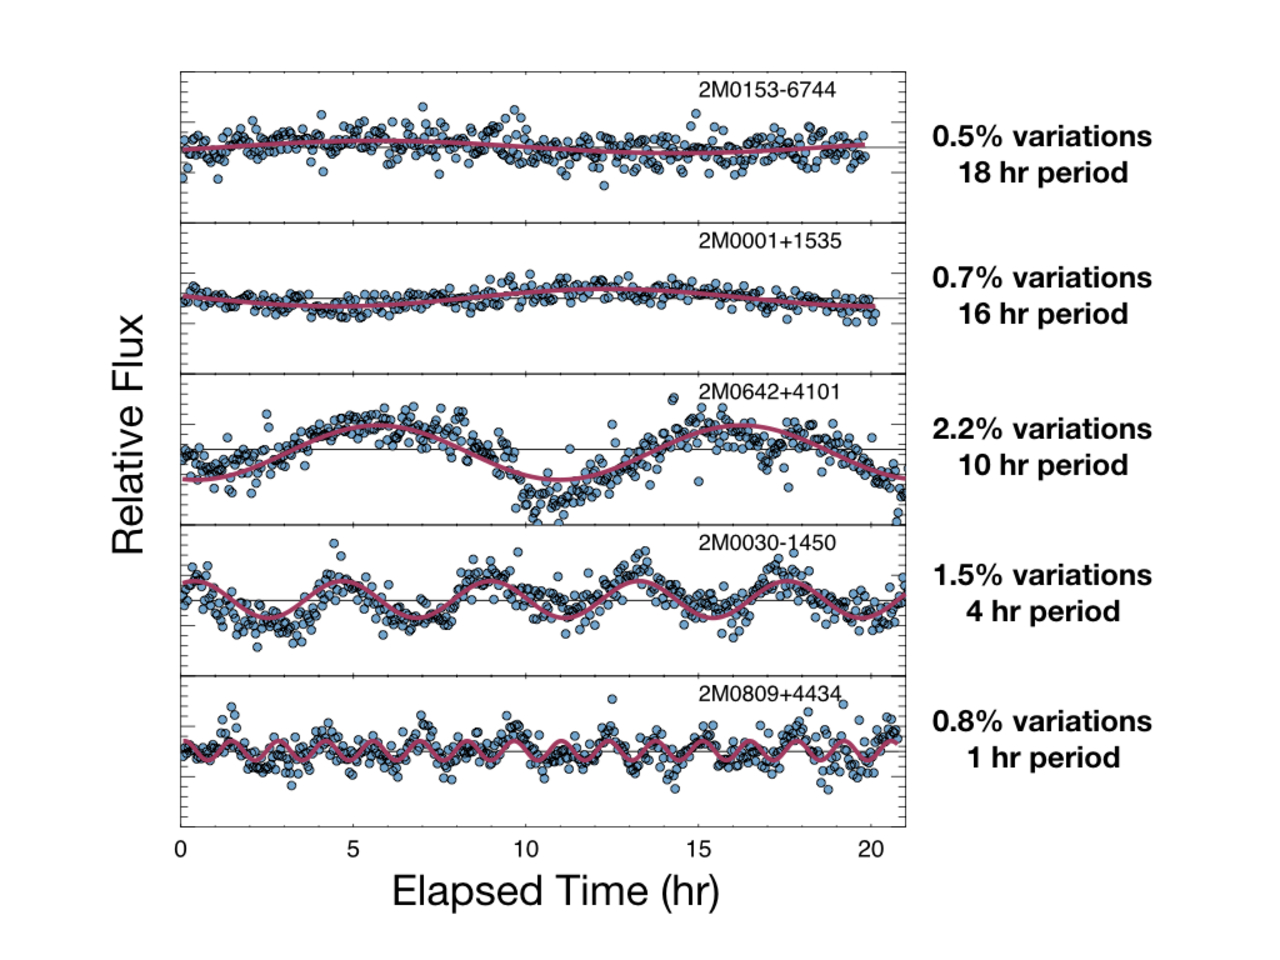
These graphs show how the light from brown dwarfs are seen to vary over time. The infrared brightnesses were measured by NASA’s Spitzer Space Telescope and demonstrate a wide range of variability in a large number of young brown dwarfs, indicative of their rotation and weather patterns.
Blue points represent the individual measurements while the pink line shows a calculated brightness curve fit to the data. These represent a selection of objects studied by Johanna Vos and her team which were presented at a AAS press conference on January 13th, 2022.
Downloads
JPG
Related Media
News Release
|
ssc2022-01
NASA’s Spitzer Illuminates Exoplanets in Astronomical Society Briefing
Artwork
|
ssc2017-10a
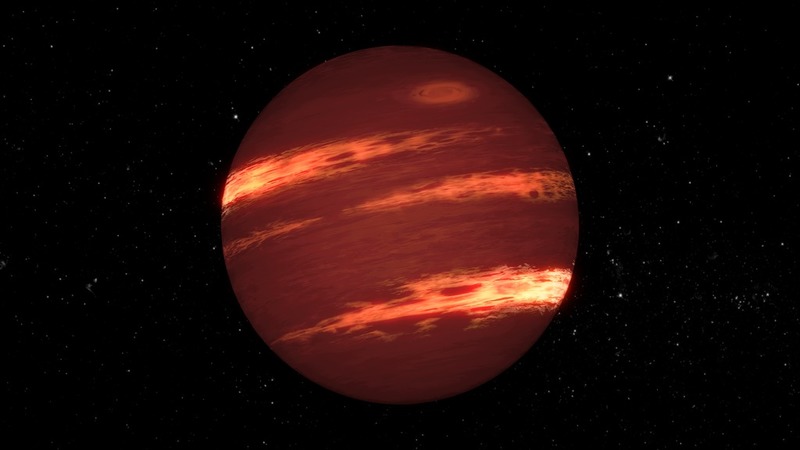
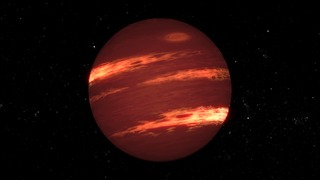
Brown Dwarf Weather
|
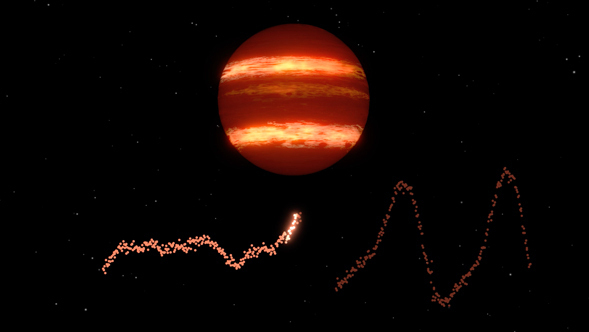
ssc2017-10v1
Brown Dwarf Weather Animated Chart

Chart
|
ssc2022-01a
Spitzer Lightcurves Subset

|
ssc2022-01b
AAS 239 Press Conference: Exoplanets & Their Atmospheres
About the Object
- Name


