
Credit: NASA/JPL-Caltech/H.Y.A. Meng (Univ. of Arizona)
Chart • August 28th, 2014 • ssc2014-06b
ssc2014-06b
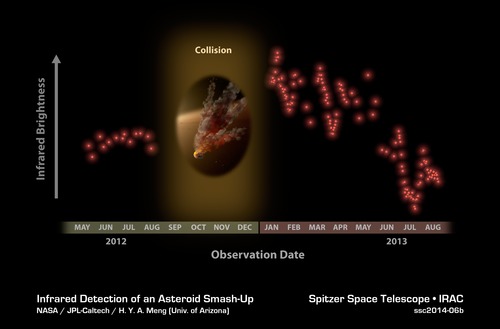
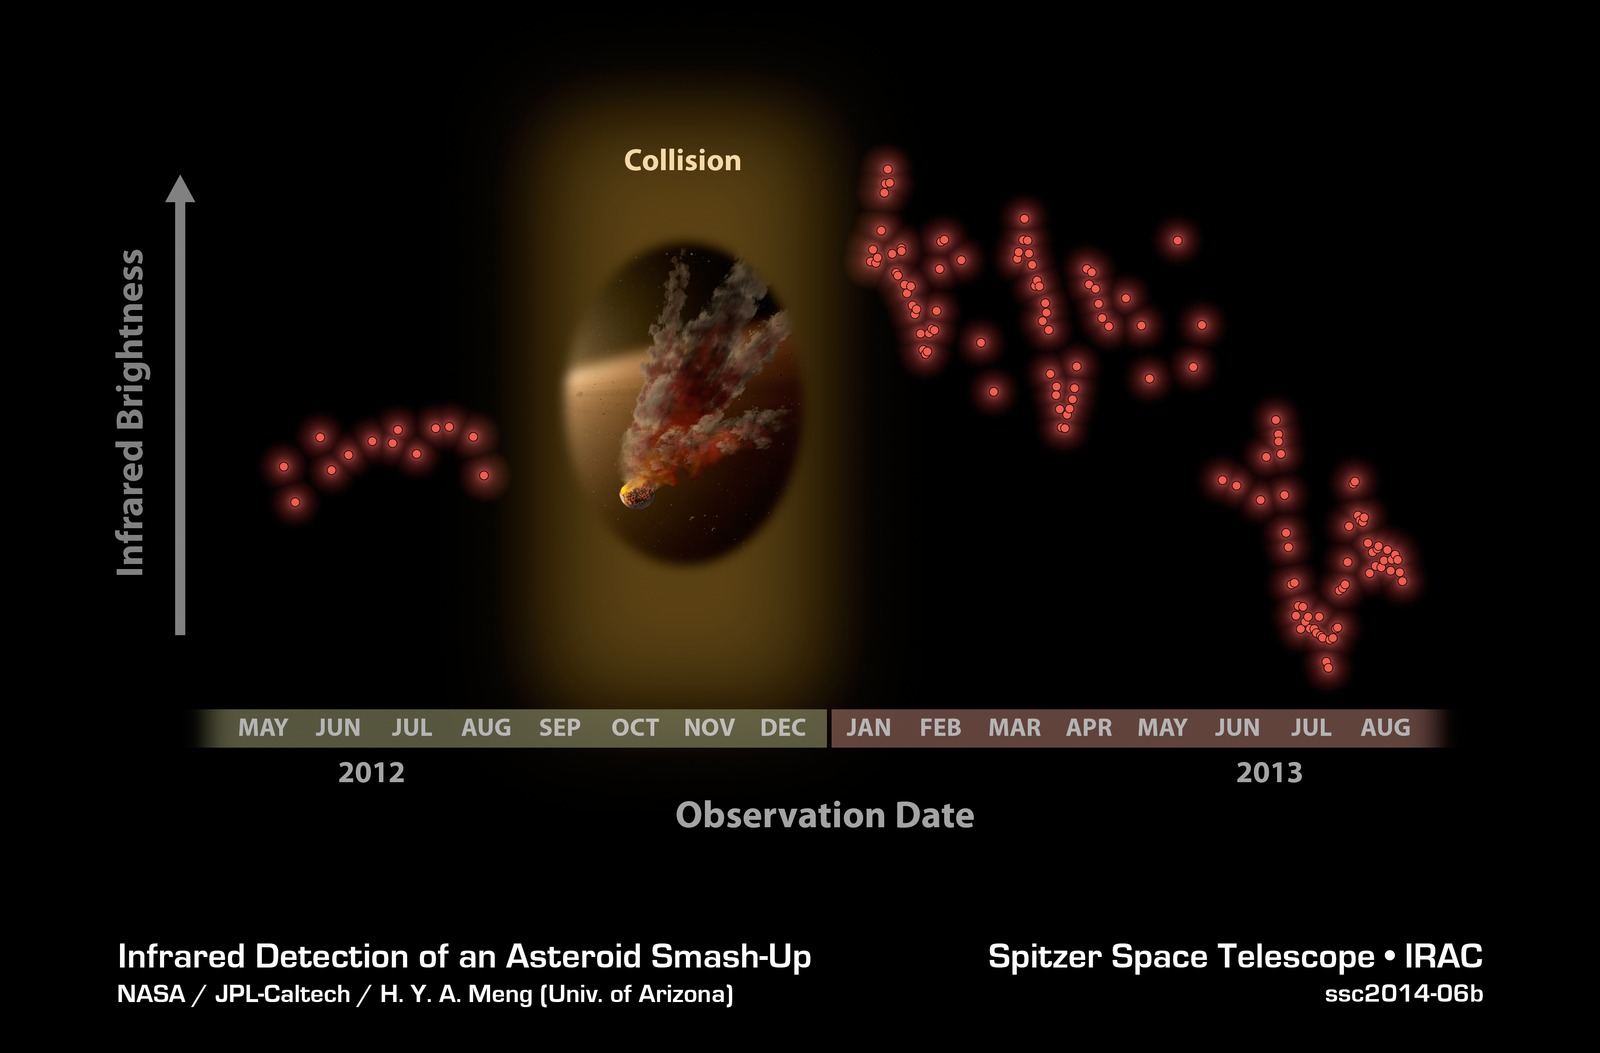
Astronomers were surprised to see these data from NASA's Spitzer Space Telescope in January 2013, showing a huge eruption of dust around a star called NGC 2547-ID8. In this plot, infrared brightness is represented on the vertical axis, and time on the horizontal axis. The data at left show infrared light from the dust around the star back in 2012. Between 2012 and 2013, Spitzer had to stop observing the star because it was located behind the sun, as seen from Spitzer's Earth-trailing orbit.
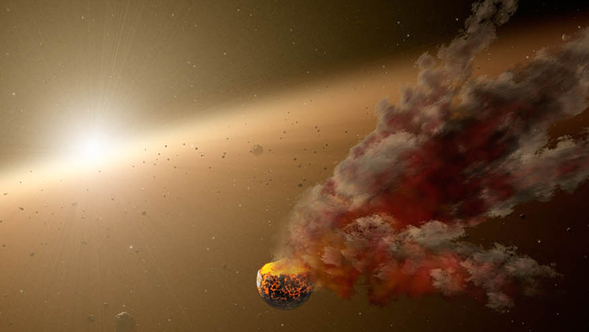
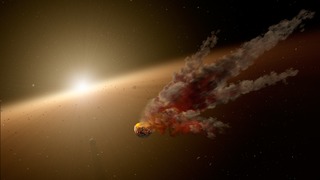
When Spitzer began watching the star again in January 2013, the astronomers noticed a huge jump in the data. (The red and blue data plots show different infrared wavelengths.) Why the dramatic change? The team says that dust in the star system surged intensely, likely after two large asteroids collided, kicking up fresh dust.
The periodic variability of the signal is caused by the remaining dust cloud in orbit around the star. This dust cloud is elongated, so the amount of infrared signal it produces changes as it circles the star from our point of view. The infrared signal is decreasing over time as dust from the collision is ground down to finer sizes and blown of the system.

About the Object
- Name
- NGC 2547-ID8
- Type
- Star > Circumstellar Material > Disk > Debris
Color Mapping
| Band | Wavelength | Telescope |
| Infrared | 4.5 µm | Spitzer IRAC |


