
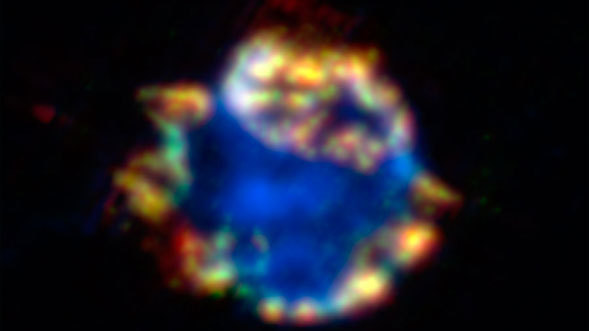
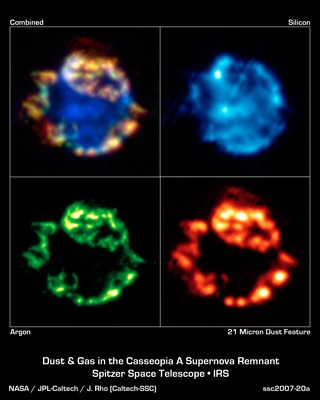
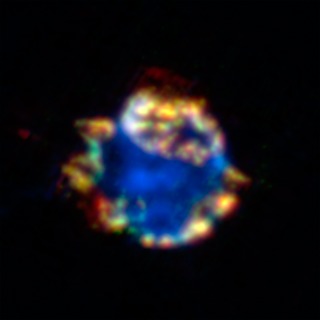
Credit: NASA/JPL-Caltech, J. Rho (Caltech-SSC)
Chart • December 20th, 2007 • ssc2007-20c
ssc2007-20c
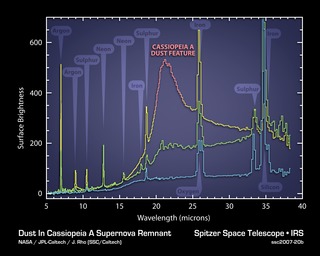
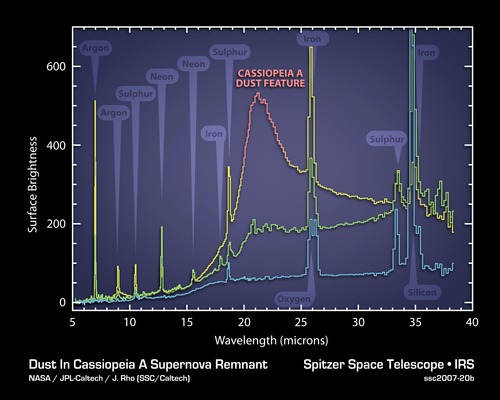
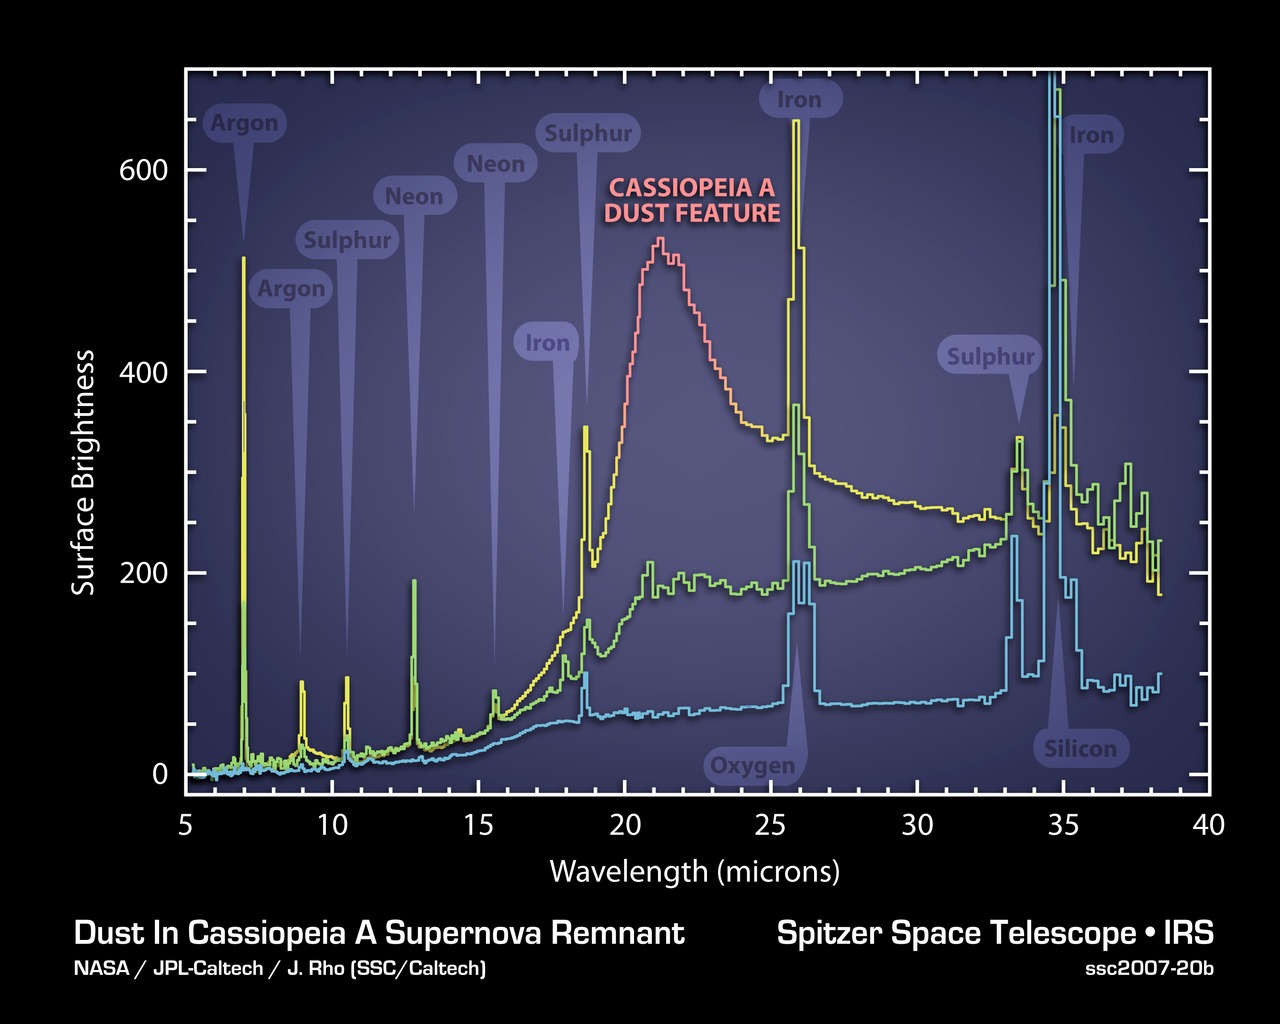
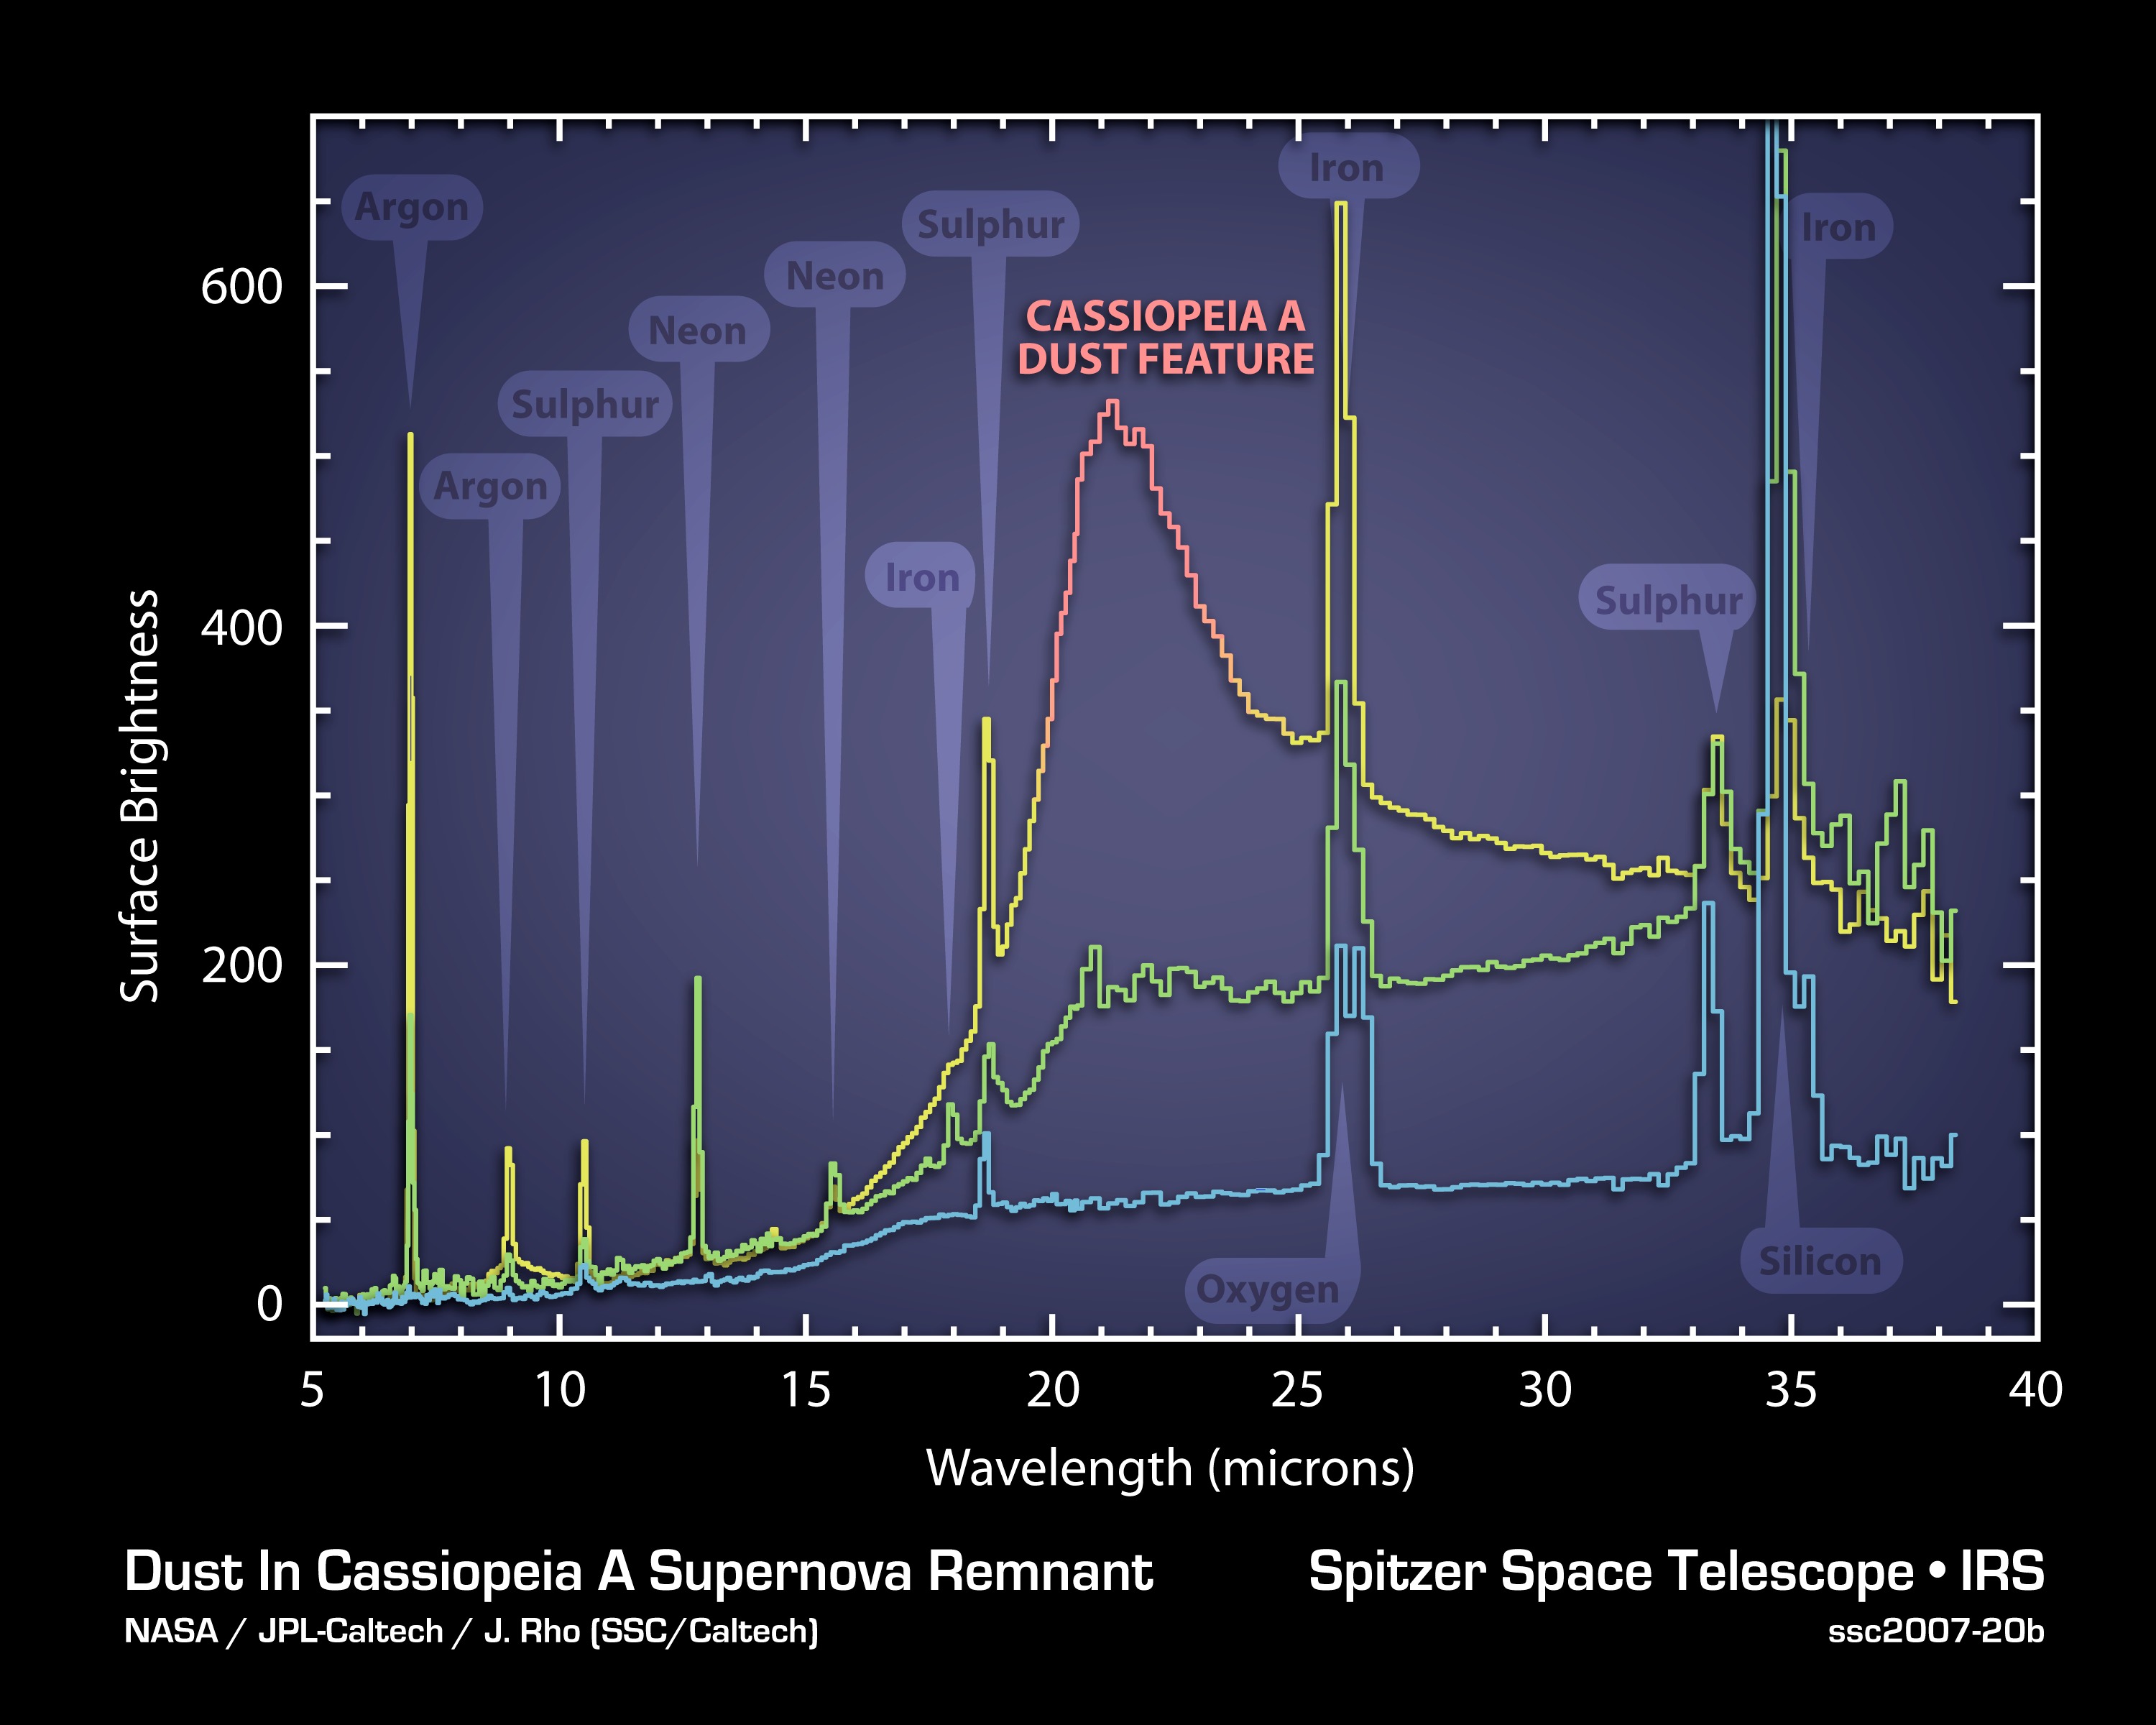
The elements and molecules that flew out of the Cassiopeia A star when it exploded about 300 years ago can be seen clearly for the first time in this plot of data, called a spectrum, taken by NASA's Spitzer Space Telescope.
The spectrum, which was created by splitting light into its basic components, reveals the composition of gas and dust that were synthesized in the explosion. It also provides some of the best evidence yet that stellar explosions, called supernovae, were a significant source of fresh dust in the very young universe. Prior to these observations, nobody was certain where this early dust -- the same dust that ultimately made its way into future stars, planets and people -- came from.
One of the most interesting features of the plot is a bump labeled "Cassiopeia A dust feature." This bump is actually the signature of a collection of dust composed of proto-silicates, silicon dioxide and iron oxide. The spectrum reveals that the brightness of the dust feature is correlated to that of argon gas (yellow vertical line at left), known to have been expelled and synthesized during the star's explosion. The fact that the dust is associated with the expelled gas, or ejecta, tells astronomers that this supernova manufactured new dust.
Each of the three lines of this plot represents a different layer of the supernova remnant, with the top yellow and red line being the outermost layer. Similar correlations between gas and dust are also seen in the middle layer (green line). For example, neon gas correlates with dust composed of carbon and aluminum oxide.
- 320x256 (53.2 KB)
- 500x400 (74.4 KB)
- 1024x819 (153 KB)
- 1280x1024 (192 KB)
- 1600x1280 (254 KB)
- 3000x2400 (555 KB)
- 3000x2400 (555 KB)
About the Object
- Name
- Cassiopeia A • Cas A
- Type
- Nebula > Type > Supernova Remnant
- Distance
- 11,000 Light Years
Color Mapping
| Band | Wavelength | Telescope |
| Infrared | Spitzer IRS |


